2026 Hybrid Work Statistics Report: Trends & Numbers
Recent research shows hybrid work has stabilized as the dominant model for remote-capable roles, with employees working from home about one day per week on average. This report brings together the latest hybrid work statistics on adoption, employee preferences, office usage, business outcomes, and policy trends across regions.
Minimum in-office days at large enterprises (structured hybrid)
0.5 Days
Average gap between employee preference and employer plans
56%
Peak U.S. office occupancy (highest since early 2020)
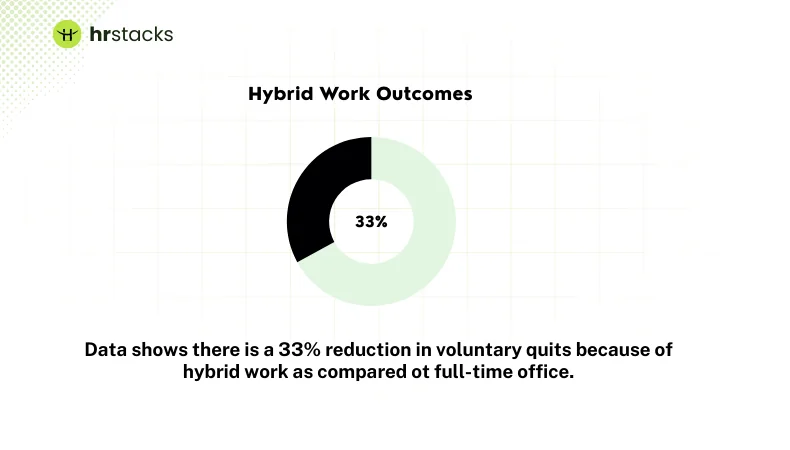
33% Lower
Voluntary quits under hybrid work (causal evidence)
Hybrid Work Statistics: Key Facts
Hybrid work has moved out of its experimental phase and into a steady, measurable pattern. Across recent surveys, employer benchmarks, and behavioral data, the numbers point to the same conclusion: most remote-capable roles now operate in a middle ground between full-time office work and fully remote setups.
The table below highlights the most important signals from the latest hybrid work data. It captures how common hybrid work is, how often people actually work from home, how employer policies are tightening, and where employee expectations still diverge from formal plans. Together, these figures set the context for the deeper regional, behavioral, and outcome-based analysis that follows.
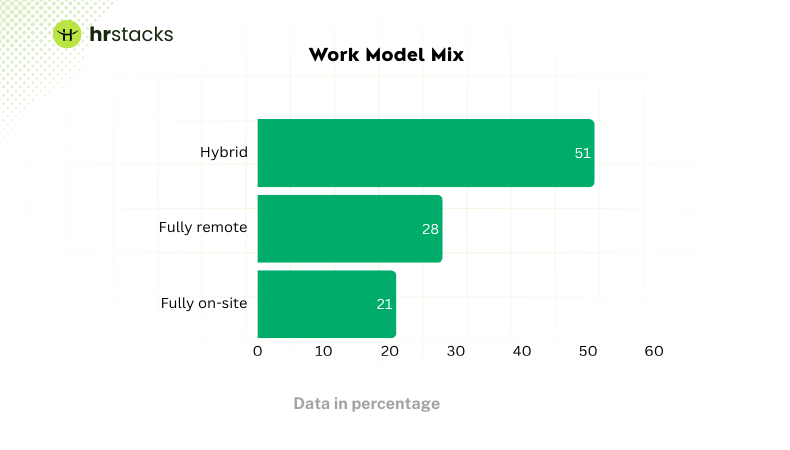
Hybrid dipped from 55% to 51% over two quarters; fully remote and fully on-site each rose ~2 pts
U.S.
Through mid–late 2025
Structured hybrid is getting firmer (Fortune 500)
Minimum required in-office days for structured hybrid rose from 2.3 (Q4 2023) to 2.9 (Q2 2025)
U.S. (Fortune 500)
Q2 2025 (latest in window)
Desire vs plan gap persists
Workers still want more WFH than employers plan (gap measured in the SWAA updates)
U.S.
Dec 2024–Apr 2025 waves
Global equilibrium of WFH
Average WFH is 1 day/week globally and steady from 2023 through early 2025
Global
Through early 2025
Strong cross-country variation
WFH is about twice as common in advanced English-speaking economies as in much of Asia
Global
Through early 2025
Updated global snapshot (survey)
G-SWA covers 40 countries and Nov 2024–Feb 2025 fieldwork, used for global comparisons
Global
Nov 2024–Feb 2025
Office occupancy trend data (behavioral)
Kastle now publishes a weekly “Peak Day Hybrid Index” (Tuesday-high, Friday-low pattern)
U.S. (10 cities)
Weekly, incl. Jan 2026
Latest U.S. office occupancy milestone
Occupancy across all buildings hit 56.3% (noted as strongest since early 2020)
U.S.
Late 2025 / early 2026 reporting
Causal evidence on retention + performance
Hybrid improved satisfaction and reduced quits by one-third, with no meaningful performance penalty
China (large tech firm; Trip.com trial)
Published 2024 (study period 2021–2022)
Exec sentiment: fewer new mandates
Only 12% of execs with hybrid/remote workers planned a new RTO mandate in the year ahead
U.S.
Survey reported Mar 2025
Benefit positioning (employer policy)
60% of employers provide hybrid work (SHRM benefits benchmarking)
U.S.
2025 survey
How to read these hybrid work statistics
Most of these numbers are about remote-capable knowledge workers, not the entire labor force. That matters. Hybrid work was never evenly distributed across industries, and these datasets intentionally track the segment where hybrid decisions actually exist.
When the table shows hybrid “stabilizing,” it doesn’t mean companies are abandoning flexibility. It means the post-pandemic reshuffle is settling into a durable pattern.
Small quarter-to-quarter shifts, like hybrid dipping a few points while fully remote and fully on-site inch up, reflect policy tightening and enforcement, not a return to pre-2020 norms. The longer-running datasets, especially global WFH frequency and office occupancy behavior, show far more stability than headlines suggest.
Check All Hybrid Work Statistics
Here are some of the most important Hybrid Work Statistics that you need to know about.
1
Regional Breakdown: How Hybrid Work Looks Around the World
Hybrid work is now common enough to feel familiar, but it still behaves very differently depending on where you look. The past year’s data shows a clear pattern: some regions have settled into hybrid as the default for knowledge work, while others are moving more cautiously, shaped by culture, commuting norms, and employer expectations.
The table below anchors the regional picture using the most recent, publicly available benchmarks.
Hybrid Work by Region (Latest Available Data)
Region
Key Hybrid Indicator
Latest Figure
Period
United States
Hybrid share of remote-capable workers
51%
2025
United States
New job postings that are hybrid
24%
H1 2025
United Kingdom
Average WFH days per week
1.8 days
2024–2025
Europe (overall)
Employers offering hybrid work
70–75%
2024–2025
Asia Pacific
Avg. WFH days per week (multi-country)
<1 day (avg.)
2024–2025
Latin America
Hybrid participation (engagement surveys)
Lower than US/UK, higher than APAC
2024–2025
North America
In the U.S., hybrid work has clearly won the middle ground. Around half of all remote-capable workers now split their time between home and office, making hybrid the single most common arrangement. Fully remote and fully on-site roles both sit well below that mark.
Hiring data reinforces the same story. Roughly one in four new job postings in the first half of 2025 were explicitly hybrid, while fully remote roles made up a much smaller share. That gap matters: it shows that employers are still offering flexibility, but increasingly in a controlled, predictable format rather than open-ended remote work.
The signal here isn’t expansion or retreat. It’s a consolidation. Hybrid in North America has moved from experimentation to maintenance.
United Kingdom & Europe
The UK stands out within Europe for how embedded hybrid work has become. Workers there average about 1.8 days per week working from home, one of the highest figures on the continent. This aligns with employer data showing that roughly three-quarters of organisations across the UK and much of Europe now support some form of hybrid working.
That said, Europe is not uniform. Hybrid adoption is generally higher in professional services, tech, and finance, and lower in manufacturing-heavy or site-based sectors. The numbers reflect that mix rather than a single European norm.
What’s consistent across the region is formalisation. Hybrid work is increasingly documented, scheduled, and managed through policy rather than left to informal team agreements.
Asia Pacific (APAC)
Hybrid work exists across APAC, but at lower average levels. Large global surveys consistently show that workers in many Asian countries average less than one day per week working from home.
This isn’t just about employer resistance. Dense cities, long-standing office cultures, and role mix all influence how hybrid shows up in practice. That said, the regional average hides sharp contrasts. Markets like Australia and Singapore report much higher hybrid participation than others, particularly in tech and knowledge-heavy sectors.
The key takeaway is variability. APAC does not move as a bloc, and regional averages should be treated as directional rather than prescriptive.
Latin America
Latin America sits between the U.S./UK model and APAC. Global engagement and workplace surveys show moderate hybrid participation, especially in urban, white-collar roles. Hybrid work is common enough to shape expectations, but not so dominant that it defines the entire labour market.
In many countries, hybrid arrangements coexist with strong on-site norms in frontline, service, and industrial roles. As a result, national averages tend to smooth over sharp internal differences.
For multinational employers, this often means hybrid policies work best when they are framed as role-based rather than country-wide.
What the regional data actually tells you
The numbers make one thing clear: hybrid work is global, but it is not uniform.
The U.S. and UK lead in adoption and normalization. Europe follows closely, with more variation by country and sector. APAC and Latin America move more selectively, shaped by local context rather than global trends.
For HR teams, this is the danger zone for copy-paste policy. A hybrid model that feels completely ordinary in New York or London may feel out of step elsewhere. The organisations that get this right tend to set global principles, then let regions tune the details.
For teams hiring internationally, these regional differences often connect directly to employment costs and local hiring models. Our Global EOR Price Index shows how Employer of Record pricing varies by country, helping teams compare costs alongside hybrid and remote work decisions.
2
Employee Preferences vs Employer Policies (Global, 2026)
There is a measurable gap between how much flexibility employees want and how much employers formally plan for. Over the past year, that gap has remained small, consistent, and global.
Employee Preferences vs Employer Plans (WFH Days per Week)
Region
Employees prefer (WFH days/week)
Employers plan (WFH days/week)
Gap
Global average
2.3 days
1.8 days
0.5 days
United States
2.5 days
2.0 days
0.6 days
UK & Europe
2.1–2.2 days
1.6–1.7 days
0.5 days
Asia Pacific
1.6–1.8 days
1.1–1.3 days
0.4–0.6 days
Figures reflect averages across remote-capable roles; values rounded to reflect survey ranges rather than point precision.
What employees want
Across countries, employee preferences have been remarkably stable. Data from the Global Survey of Working Arrangements shows that workers in remote-capable roles generally prefer around two to two-and-a-half days per week working from home. That preference has not meaningfully declined over the past 12 months.
Even in regions where hybrid adoption is lower, employees still express a desire for more flexibility than they currently receive. The difference is one of degree, not direction. Preferences vary by country and role, but the underlying pattern is consistent.
In other words, employee expectations have settled. They are no longer drifting back toward full-time office work, nor pushing strongly toward fully remote arrangements.
What employers are planning
Employer policies tell a different story.
Large employer benchmarking shows that structured hybrid models now dominate formal policy design. In these models, companies typically require around three in-office days per week, which translates to roughly two days working from home in practice.
Flex Index tracking shows that minimum in-office requirements have edged upward over the past year, particularly among large and multinational employers. Smaller firms remain more flexible, but even there, fully open-ended policies are becoming less common.
Globally, this has resulted in employer plans clustering closer to one to two WFH days per week, below employee preference levels in nearly every region measured.
The gap, and why it persist
When preferences and plans are compared directly, the gap consistently lands at about half a day per week.
That gap appears in:
North America
Europe
Asia Pacific
Global averages
The persistence of the gap is the key insight. It is not shrinking, but it is not widening either. Both sides have largely stopped moving.
Employees have anchored their expectations around flexibility with structure. Employers have anchored their policies around coordination with flexibility. Neither position is extreme, but they do not fully align.
Why half a day matters
A half-day difference is easy to dismiss in isolation. Across a workforce, it becomes meaningful.
Survey evidence shows that dissatisfaction with hybrid policies tends to surface not when flexibility disappears, but when it feels slightly tighter than expected. That makes the desire–plan gap a leading indicator of hiring friction and retention risk, particularly for roles where employees have alternatives.
Importantly, this is not a signal that organizations need to add another remote day. The data suggests the friction often comes from how flexibility is structured rather than the absolute number of days.
What HR teams should take from this
This is no longer a question of ideology. It’s a question of calibration.
The global data shows a narrow but durable mismatch between employee expectations and employer plans. Organizations that acknowledge and manage that mismatch tend to absorb it. Those who ignore it tend to feel it later, through slower hiring, disengagement, or attrition.
In 2026, hybrid work tension doesn’t live at the extremes. It lives in the margins.
3
What People Actually Do (Behavioral Data vs Policy)
Hybrid policies describe intent. Behavioral data shows reality. When you look at badge swipes, access logs, and observed office usage, a consistent pattern emerges: employees comply with hybrid policies, but they cluster their presence into predictable rhythms that policy documents rarely capture.
Observed Office Usage vs Formal Policy
Metric
Observed Behavior
Period
Notes
Average office occupancy (multi-city)
50–56%
2025–early 2026
Across major U.S. metros
Peak in-office day
Tuesday (60%+)
Weekly pattern
Stable across quarters
Lowest in-office day
Friday (30–35%)
Weekly pattern
Consistently lowest
Midweek clustering
Tue–Thu dominate
Ongoing
Regardless of stated flexibility
Change vs early 2024
Gradual increase
12-month trend
Not a full return
Occupancy figures reflect access-controlled office buildings and measure presence, not time spent.
What the data shows clearly
Across large office markets, average in-office attendance now sits just above half capacity, even in organizations with formal hybrid requirements. This level has edged upward over the past year, but slowly. There is no evidence of a sudden swing back to full-time office work.
More striking than the averages is the weekly shape. Office usage consistently peaks midweek, with Tuesdays recording the highest attendance and Fridays the lowest. This pattern holds regardless of whether companies mandate two, three, or even four in-office days.
In practice, employees comply with the minimum expectations, then optimize around them.
Policy says “three days.” Behavior says “these three days.”
Many organizations now require two to three days in the office. Behavioral data suggests employees respond by synchronizing their attendance rather than spreading it evenly.
That synchronization produces:
Crowded offices midweek
Underutilized space on Mondays and Fridays
Meeting-heavy days clustered into the same 48–72 hour window
From a policy perspective, the requirement is being met. From an operational perspective, space and collaboration are unevenly loaded.
Global context (and limits of the data)
Reliable behavioral data is strongest in North America, where badge and access-control systems are widely deployed and publicly reported. Comparable global datasets are thinner.
That said, survey-based evidence from global research consistently shows the same pattern of clustering: even where average WFH days differ by country, employees tend to coordinate their office presence around shared days rather than distributing it evenly.
This suggests the behavior is not uniquely American. It’s structural.
4
Business Outcomes: Retention, Productivity, Performance
Hybrid work outcomes are no longer hypothetical. Over the past few years, enough large-scale studies, experiments, and global surveys have accumulated to draw cautious but defensible conclusions. The strongest signals appear in retention, while productivity and performance outcomes are smaller but largely neutral.
Hybrid Work and Retention (Observed Outcomes)
Outcome
Result
Region
Period
Reduction in voluntary quits (hybrid vs full on-site)
33% lower
China (large tech firm)
Study published 2024
Employees reporting lower intent to leave
Consistently lower
Global
2024–2025
Retention impact strongest when moving from on-site → hybrid
Yes
Global
Ongoing surveys
The clearest causal evidence comes from a randomized controlled trial at Trip.com, where employees assigned to a hybrid schedule were about one-third less likely to quit than those required to work fully on-site. This remains the most rigorous evidence available because employees were randomly assigned, removing self-selection bias.
Global survey data supports this directionally. Across countries, workers with access to hybrid arrangements report lower intent to leave than those without flexibility, even when controlling for job type.
Hybrid Work and Productivity
Productivity Measure
Finding
Region
Period
Measured productivity change (hybrid vs on-site)
+0.5% to +1%
China (RCT)
Published 2024
Self-reported productivity (hybrid vs on-site)
Neutral to slightly higher
Global
2024–2025
Evidence of productivity decline due to hybrid
None at scale
Global
2024–2025
In the same Trip.com experiment, hybrid workers showed a small but measurable productivity increase, under 1%. While modest, the key finding is directional: productivity did not decline.
Survey-based global research echoes this pattern. Across regions, hybrid workers generally report productivity levels that are similar to or slightly higher than those working fully on-site. Results vary widely by role, but large datasets do not show systematic productivity losses tied to hybrid schedules.
Performance Ratings and Career Outcomes
Career Outcome
Hybrid vs On-site Result
Region
Period
Promotion rates
No significant difference
China (RCT)
Published 2024
Performance evaluation scores
No material penalty
China (RCT)
Published 2024
Perceived career risk among hybrid workers
Higher concern than measured impact
Global
2024–2025
In the Trip.com trial, hybrid employees were no less likely to be promoted and received comparable performance ratings to their fully in-office peers. This directly challenges the assumption that reduced office presence leads to career penalties.
However, global surveys show that perceptions lag behind outcomes. Many employees still believe being visible in the office improves advancement prospects, even when measured promotion data does not support that belief. This perception gap matters because it shapes behavior and satisfaction.
What the global evidence supports
Taken together, the data supports a narrow but important set of conclusions:
Hybrid work reduces voluntary turnover, especially relative to fully on-site models
Hybrid work does not materially harm productivity on average
Hybrid work does not show a measurable promotion penalty in the strongest causal evidence available
What the data does not support is the idea that hybrid work automatically boosts performance or output. Any productivity gains tend to be incremental and context-dependent.
What this means for HR and leadership
Hybrid work’s business value shows up most clearly as risk reduction. Lower turnover and stable performance reduce hiring pressure and preserve institutional knowledge.
The outcomes data also suggests limits. Hybrid work is not a substitute for good management, clear goals, or fair evaluation systems. Where those are weak, flexibility alone does not compensate.
5
Hiring & Talent Market Effects
Hybrid work has become a labor-market signal. Over the past year, data from employer surveys, job postings, and worker preference studies shows that flexibility now influences who applies, who accepts offers, and how competitive roles feel, even when pay and title are unchanged.
Hybrid Work and Candidate Preferences
Hiring Signal
Measured Effect
Region
Period
Workers preferring hybrid over fully on-site roles
Majority of remote-capable workers
Global
2024–2025
Workers willing to trade pay for flexibility
Meaningful minority
Global
2024–2025
Hybrid ranked among top job-selection factors
Yes
U.S., Europe
2024–2025
Global survey data consistently shows that most workers in remote-capable roles prefer hybrid arrangements over fully on-site work. Fully remote remains attractive to some, but hybrid dominates as the preferred compromise between flexibility and connection.
In hiring contexts, flexibility is no longer treated as a “nice to have.” In multiple surveys, it ranks alongside compensation, role scope, and career growth as a deciding factor for job selection.
Job Postings and Labor Demand
Job Market Indicator
Share
Region
Period
New job postings labeled hybrid
20–25%
United States
2025
New job postings labeled fully remote
10–15%
United States
2025
Decline in fully on-site postings (knowledge roles)
Yes
U.S., Europe
2024–2025
Employer-side data shows that hybrid roles now outnumber fully remote roles in new postings, particularly for professional and knowledge-based jobs. Fully on-site postings still exist at scale, but they are increasingly concentrated in roles where physical presence is inherent.
This shift matters because postings shape candidate expectations. When hybrid appears routinely in listings, it becomes a baseline rather than a differentiator.
Offer Acceptance and Hiring Friction
Metric
Hybrid vs On-site
Region
Period
Offer acceptance rates
Higher for hybrid roles
U.S., Europe
2024–2025
Time-to-fill
Shorter for hybrid roles
U.S.
2024–2025
Candidate drop-off late in process
Lower with flexibility
Global
2024–2025
Where measured, hybrid roles tend to see higher offer acceptance rates and lower late-stage candidate drop-off compared to fully on-site positions. The effect is most visible in competitive labor markets and in roles with scarce skills.
This does not mean hybrid eliminates hiring difficulty. It reduces friction at the margin, often enough to matter when teams are competing for the same talent pool.
Global variation in hiring impact
The hiring advantage of hybrid work is strongest in regions where:
commuting times are long
multiple employers compete for similar skill sets
hybrid norms are already established
In regions where on-site work remains the dominant expectation, hybrid still improves candidate interest, but the effect on acceptance rates is smaller. As with other aspects of hybrid work, labor-market impact is directional rather than uniform.
What the hiring data actually supports
Across datasets, the hiring signal is consistent:
Hybrid work widens the candidate pool for remote-capable roles
Hybrid roles convert candidates more effectively than on-site-only roles
The advantage is incremental but persistent, not dramatic
Importantly, the data does not support the idea that hybrid alone solves hiring challenges. Compensation, role clarity, and brand still dominate. Hybrid flexibility works best as a multiplier, not a substitute.
What this means for HR and recruiting teams
By 2026, hybrid work has shifted from being a differentiator to being a filter.
Organizations that remove flexibility from roles where it is feasible should expect smaller applicant pools and slower acceptance, even if everything else remains competitive. Organizations that offer hybrid but communicate it vaguely often fail to realize the benefit.
In hiring, clarity matters as much as flexibility itself.
6
Equity, Career Progression & Management Impact
As hybrid work becomes routine, concerns about fairness and career impact haven’t disappeared. They’ve shifted. The key question now is not whether hybrid workers are disadvantaged in theory, but whether measurable outcomes and perceptions are starting to diverge.
Career Progression: Measured Outcomes vs Perception
Indicator
Measured Result
Region
Period
Promotion rates (hybrid vs on-site)
No significant difference
China (RCT)
Published 2024
Performance evaluation scores
No measurable penalty
China (RCT)
Published 2024
Employees who believe office presence improves advancement
Majority agree
Global
2024–2025
Concern about visibility bias
Common among hybrid workers
Global
2024–2025
The strongest causal evidence available shows no promotion or performance penalty for hybrid workers. In the Trip.com randomized trial, hybrid employees advanced at similar rates and received comparable evaluations to fully in-office peers.
At the same time, survey data shows a persistent perception gap. Across regions, many employees still believe physical presence improves career prospects, even where formal outcomes do not support that belief. This matters because perception influences behavior long before it appears in HR metrics.
Uneven Access to Hybrid Work
Equity Dimension
Observed Pattern
Region
Period
Hybrid access by income level
Higher among higher earners
UK, Global
2024–2025
Hybrid usage by gender
Higher among women
Global
2024–2025
Hybrid usage by career stage
Lower among early-career workers
Global
2024–2025
Hybrid work is not evenly distributed. Data from national labor surveys and global workforce studies shows that higher-paid and more senior employees are significantly more likely to have access to hybrid arrangements. Early-career employees and lower-income roles are less likely to benefit, often due to role design rather than policy intent.
This creates equity risk, not necessarily inequity by default. The risk emerges when evaluation and advancement systems implicitly reward presence rather than outcomes.
Management Capability as the Pressure Point
Management Indicator
Signal
Region
Period
Managers confident leading hybrid teams
Minority report high confidence
Global
2024–2025
Managers reporting coordination strain
Majority
Global
2024–2025
Need for clearer performance metrics
Widely reported
Global
2024–2025
Across global surveys, managers consistently report that hybrid teams are harder to evaluate and coordinate. Where goals, feedback, and expectations are informal, hybrid increases perceived unfairness. Where performance is clearly defined, those concerns diminish.
The data suggests that management quality, not hybrid itself, is the dominant driver of equity outcomes.
What the evidence supports
Hybrid work does not show a measured career penalty in causal studies
Perceived visibility bias remains widespread, even without measured impact
Access to hybrid work is uneven by role, income, and career stage
Manager capability is the largest risk factor for inequity
Hybrid work does not automatically create inequity. But it does expose weak evaluation systems faster.
7
Real Estate, Cost & Operational Impact
Hybrid work has changed office usage patterns more than it has eliminated offices. The clearest signals come from utilization and footprint data rather than headline lease exits.
Office Utilization (Observed Behavior)
Metric
Level
Region
Period
Average office occupancy
50–56%
U.S. major cities
2025–early 2026
Highest occupancy day
Tuesday (~60%+)
U.S.
Ongoing
Lowest occupancy day
Friday (~30–35%)
U.S.
Ongoing
Year-over-year change
Slight increase
U.S.
Last 12 months
Offices are used more than in early hybrid phases, but utilization remains well below full capacity. Attendance consistently clusters midweek, regardless of stated policy.
Office Footprint & Space Strategy
Indicator
Direction
Region
Period
Total office footprint
Flat to declining
U.S., Europe
2024–2025
Square footage per employee
Decreasing
Global
2024–2025
Desk sharing / hoteling
Increasing
Global
2024–2025
Collaboration-focused redesign
Common
Global
2024–2025
Most organizations are optimizing space, not abandoning it. Reductions are incremental and tied to efficiency rather than full exit strategies.
Cost Effects
Cost Area
Observed Impact
Region
Period
Facilities costs
Moderately reduced
U.S., Europe
2024–2025
Cleaning & utilities
Shifted toward midweek peaks
Global
2024–2025
Overall real estate savings
Incremental
Global
2024–2025
Hybrid work produces partial cost savings, but uneven attendance limits large reductions. Savings depend heavily on aligning services with actual usage.
What the data supports
Offices operate at roughly half capacity on average
Utilization is stable, not reverting to pre-pandemic norms
Real estate strategies focus on efficiency, not elimination
Cost benefits exist, but are operationally dependent
8
Regulation & Policy Environment
Hybrid work policy is increasingly shaped by formal legal frameworks rather than informal employer discretion. Over the past 12–18 months, most regulatory movement has focused on process rights, not mandated work models.
Key Hybrid & Flexible Work Regulations (By Region)
Region
Regulation / Policy
What It Requires
Effective
United Kingdom
Day-one right to request flexible working
Employees can request flexible or hybrid work from day one; employers must follow a defined process
Apr 2024
United Kingdom
Acas Code of Practice
Sets guidance on handling flexible work requests fairly and consistently
Apr 2024
European Union
Right to disconnect (ongoing)
Member states encouraged to protect off-hours boundaries; not a uniform mandate yet
2024–2025
European Union
Telework & hybrid frameworks
Focus on fair treatment, working time, and health & safety
Ongoing
United States
No federal hybrid mandate
Hybrid work remains employer-led; governed indirectly by labor and discrimination law
Ongoing
Global
Flexible work as accommodation
Hybrid often treated as a reasonable accommodation in specific cases
Ongoing
What regulation does not mandate
Across major regions:
No jurisdiction mandates a specific number of remote or in-office days
No country requires employers to adopt hybrid work universally
Most laws focus on request rights, process fairness, and documentation, not outcomes
This means hybrid remains a strategic and operational decision, constrained by procedure rather than prescription.
What the policy data supports
Governments are codifying flexibility as a right to request, not a right to receive
Employers retain discretion, but must justify and document decisions
Compliance risk is procedural, not structural
For multinational employers, inconsistency is the main challenge: hybrid policies must align with local request handling, record-keeping, and manager training requirements.
Conclusion: What the Data Says About Hybrid Work in 2026
Across regions, industries, and company sizes, the data shows a stable middle ground: employees expect some flexibility, employers formalize it with structure, and actual behavior settles into predictable rhythms. The gaps that remain are narrow but persistent, half-days, not whole weeks, and that’s where most friction now lives.
The strongest evidence points to three things. First, hybrid work reduces turnover risk without harming performance. Second, productivity outcomes are largely neutral, with small gains or losses depending on role and execution rather than work model. Third, the biggest risks are not structural but managerial: uneven access, perceived visibility bias, and unclear performance standards.
Hybrid work in 2026 isn’t about choosing sides. It’s about calibration. Organizations that treat hybrid as an operating system, measured, adjusted, and localized, tend to absorb its tensions. Those that treat it as a slogan or a mandate tend to feel them later.
The argument phase is over. What remains is design.
Manjuri Dutta
Manjuri Dutta is the co-founder and Content Editor of HR Stacks, a leading HR tech and workforce management review platform, and EmployerRecords.com, specializing in Employer-of-Record services for global hiring. She brings a thoughtful and expert voice to articles designed to inform HR leaders, practitioners, and tech buyers alike.
Four-Day Workweek Statistics: Conclusion Trials across countries are starting to show a consistent pattern. Productivity doesn’t collapse when hours are
Get the latest from the HR & AI tech industry. All your news at one place.
HR Stacks uses cookies
This website uses cookies to enhance user experience and to analyze performance and traffic on our website. By continuing to browse this site you are agreeing to our use of cookies.