Diversity, equity, and inclusion (DEI) has shifted from a policy-driven initiative to a data-driven business priority. Organizations are no longer evaluated based on commitments alone, but on measurable outcomes across hiring, promotion, pay equity, and employee experience.
Recent data shows a clear pattern: while companies have improved diversity at entry levels, significant gaps remain in leadership representation, compensation, and career progression.
For example, women hold 63% of entry-level roles but only 29% of C-suite positions, and companies in the top quartile for ethnic diversity are 39% more likely to outperform financially.
At the same time, DEI is increasingly tied to business performance and workforce outcomes. Diverse leadership teams generate 45% of revenue from innovation compared to 26% for less diverse teams, and employees experiencing bias are 1.4× more likely to leave their jobs.
Regulatory pressure and workforce expectations are also accelerating change. Over 10,000 companies in the UK now report gender pay gap data, and 76% of job seekers consider diversity when evaluating employers.
DEI Statistics 2026: At A Glance
- Companies in the top quartile for ethnic diversity are 39% more likely to outperform financially.
- Diverse leadership teams generate 45% of revenue from innovation vs 26% for less diverse teams.
- Women hold 63% of entry-level roles but only 29% of C-suite positions.
- For every 100 men promoted, only 87 women and 73 women of color are promoted.
- Women earn 83.6% of men’s weekly earnings, with wider gaps across race and ethnicity.
- Employees experiencing bias are 1.4× more likely to consider leaving their jobs.
- Disability employment rate is 22.5% vs 65.8% for non-disabled workers.
- Women hold 32.2% of global board seats but only 10.4% of board chair roles.
- 76% of employees and job seekers consider workforce diversity when evaluating employers.
- 33% of LGBTQ+ employees would leave for a more inclusive workplace.
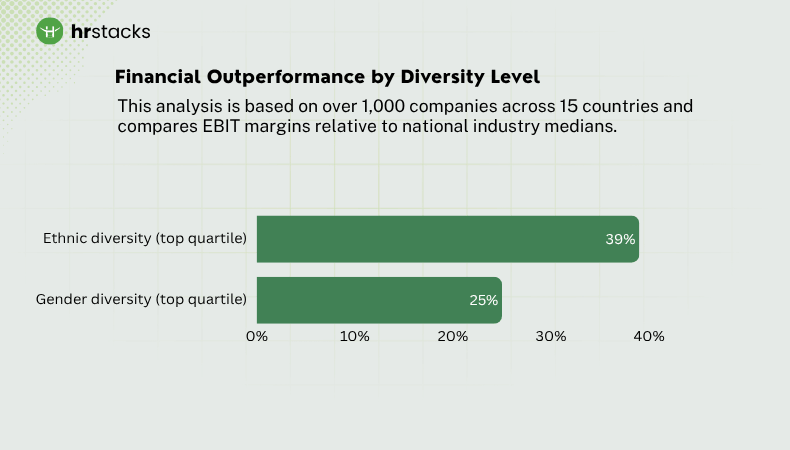
Companies in the Top Diversity Quartile Are 39% More Likely to Outperform Financially
The most widely cited evidence linking diversity to financial performance comes from McKinsey & Company’s multi-year research.
Financial Outperformance by Diversity Level
| Diversity Category | Likelihood of Above-Average Profitability |
|---|---|
| Ethnic diversity (top quartile) | +39% |
| Gender diversity (top quartile) | +25% |
This analysis is based on over 1,000 companies across 15 countries and compares EBIT margins relative to national industry medians.
What this shows:
The performance advantage is strongest when diversity exists at the executive level, where strategic decisions are made.
Source: McKinsey
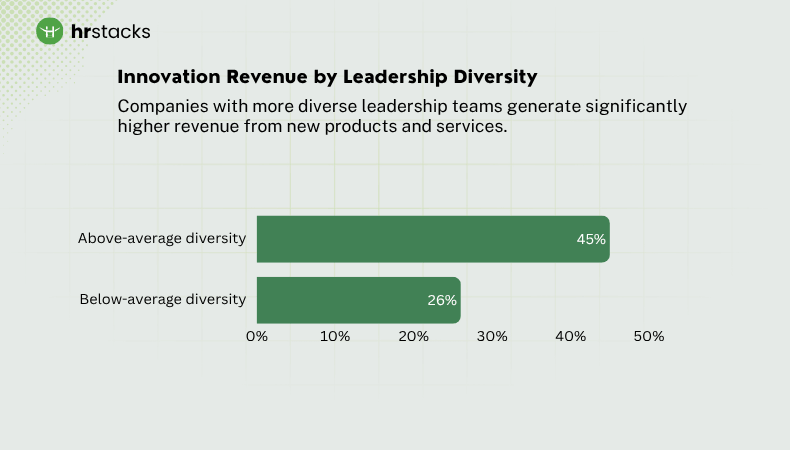
Companies With Diverse Leadership Teams Generate 19 Percentage Points More Revenue From Innovation
One of the clearest business impacts of diversity is its effect on innovation. A global study by Boston Consulting Group (BCG) found that companies with more diverse leadership teams generate significantly higher revenue from new products and services.
Innovation Revenue by Leadership Diversity
| Company Type | Share of Revenue From New Products |
|---|---|
| Above-average diversity | 45% |
| Below-average diversity | 26% |
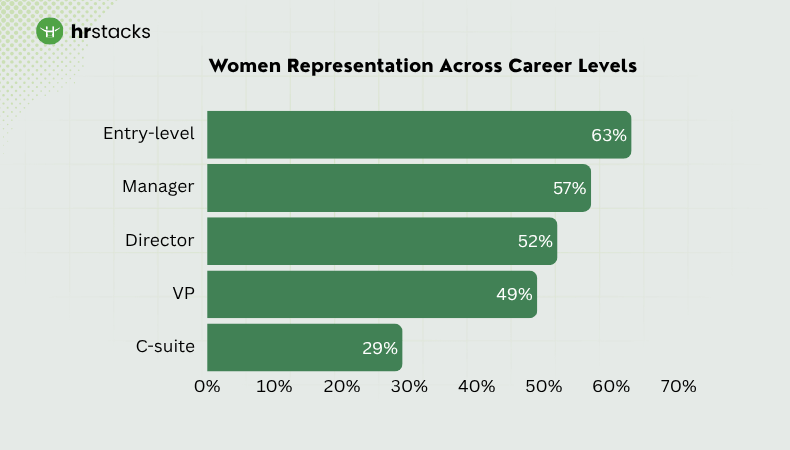
Women Hold 63% of Entry-Level Roles but Only 29% of C-Suite Positions
Representation improves at entry levels but declines sharply in leadership roles. This pattern is consistently observed in McKinsey & Company’s annual workplace studies.
Women Representation Across Career Levels
| Level | Women Representation |
|---|---|
| Entry-level | 63% |
| Manager | 57% |
| Director | 52% |
| VP | 49% |
| C-suite | 29% |
What this shows:
The largest drop occurs at the first promotion step to manager, often referred to as the “broken rung,” which compounds over time.
Source: McKinsey
For Every 100 Men Promoted to Manager, Only 87 Women and 73 Women of Color Are Promoted
The largest structural barrier to gender equality in the workplace occurs at the first step into management. This gap, often referred to as the “broken rung,” limits the number of women who advance into leadership pipelines.
Promotion Rates at the First Step to Management
| Group | Promotions per 100 Men |
|---|---|
| Women | 87 |
| Women of color | 73 |
This data is based on large-scale employer and employee surveys analyzing promotion outcomes across corporate roles.
Source: McKinsey & Company
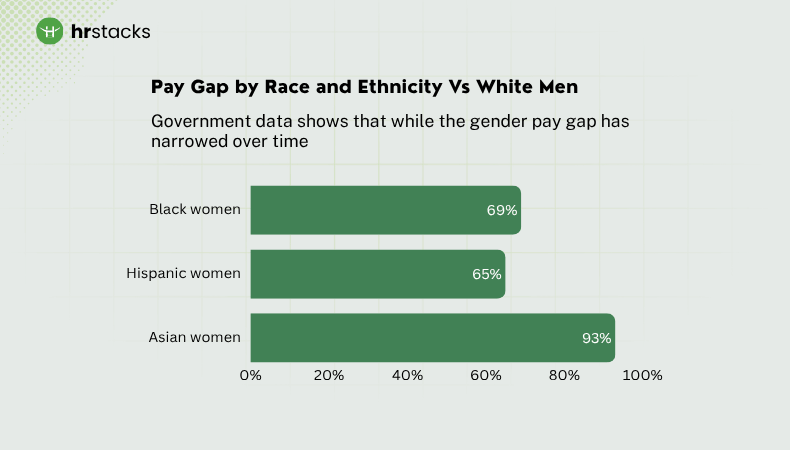
Women Earn 83.6% of Men’s Weekly Earnings in the U.S., With Larger Gaps Across Race and Ethnicity
Pay equity remains one of the most measurable and persistent disparities in the labor market. Government data shows that while the gender pay gap has narrowed over time, it continues to affect earnings across industries and roles.
Median Weekly Earnings Comparison (Full-Time Workers, U.S.)
| Group | Earnings vs Men |
|---|---|
| Women (overall) | 83.6% |
This figure represents the median weekly earnings of full-time wage and salary workers and is one of the most widely used benchmarks for measuring the gender pay gap in the United States.
Intersectional Pay Gap by Race and Ethnicity
Pay disparities vary significantly when broken down by race and ethnicity.
| Group | Earnings vs White Men |
|---|---|
| Black women | 69% |
| Hispanic women | 65% |
| Asian women | 93% |
Most Companies Track Diversity Metrics, but Few Tie Outcomes to Leadership Accountability
Organizations have made progress in measuring diversity, but translating those metrics into leadership accountability remains limited. Research consistently shows a gap between tracking diversity data and embedding it into performance systems.
Adoption of Diversity Measurement vs Accountability
A majority of large organizations now track diversity metrics across hiring, promotion, and representation
Far fewer organizations link these metrics to:
- Executive performance evaluations
- Compensation or incentives
- Board-level oversight
McKinsey notes that while diversity tracking has become common, accountability mechanisms are still evolving and inconsistently applied.
Where Accountability Gaps Typically Occur
Accountability is weakest in areas that require structural change:
| Area | Common Gap |
|---|---|
| Executive compensation | Limited linkage to DEI outcomes |
| Performance reviews | DEI goals not consistently measured |
| Board oversight | Inconsistent monitoring of diversity progress |
Women Experiencing Microaggressions Are 1.4× More Likely to Consider Leaving Their Jobs
Workplace inclusion has a measurable impact on retention, particularly for women. Research shows that women who experience microaggressions and other forms of bias are significantly more likely to consider leaving their organization.
Source: McKinsey & Company
What “Experiencing Bias” Includes
McKinsey’s research identifies several common workplace experiences that contribute to attrition risk:
- Being interrupted or talked over in meetings
- Having judgment questioned or expertise undervalued
- Receiving less support from managers
- Being excluded from informal networks or opportunities
These experiences are often cumulative and affect both engagement and career progression.
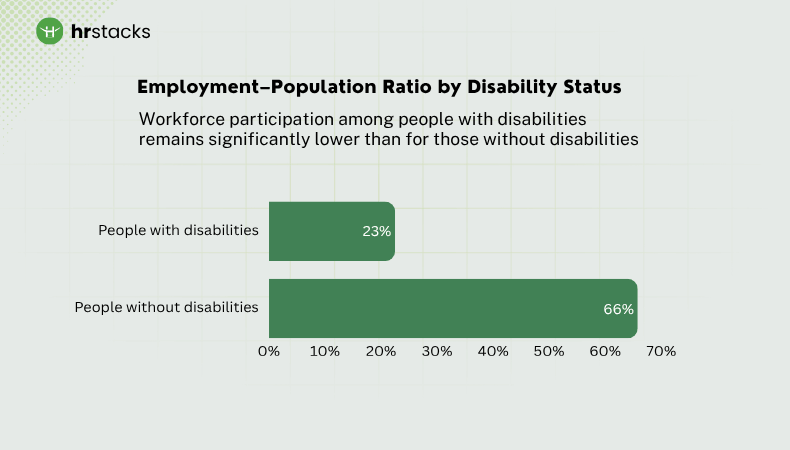
Disability Employment Rate Is 22.5% Compared to 65.8% for People Without Disabilities
Workforce participation among people with disabilities remains significantly lower than for those without disabilities, making it one of the most persistent gaps in labor market inclusion.
Employment–Population Ratio by Disability Status (U.S., 2023)
| Group | Employment–Population Ratio |
|---|---|
| People with disabilities | 22.5% |
| People without disabilities | 65.8% |
What This Metric Measures
The employment–population ratio represents the share of individuals in each group who are currently employed, providing a direct comparison of workforce participation.
A gap of over 40 percentage points indicates that people with disabilities are far less likely to be employed, regardless of broader labor market conditions.
Structural Drivers Behind the Gap
BLS data, combined with workforce research, points to several systemic factors:
- Hiring barriers: Limited accessibility in application systems and screening processes
- Workplace accommodation gaps: Inconsistent availability of adaptive tools and support
- Occupational concentration: Lower representation in high-growth and technical roles
- Employer bias and risk perception: Hesitancy around perceived cost or productivity impact
Source: U.S. Bureau of Labor Statistics
76% of Employees and Job Seekers Say a Diverse Workforce Is Important When Evaluating Employers
Diversity is a measurable factor in employer evaluation, influencing both job applications and acceptance decisions. Survey data shows that a majority of candidates consider workforce diversity when assessing potential employers.
Candidate Preferences on Workplace Diversity
| Metric | Percentage |
|---|---|
| Employees and job seekers who consider workforce diversity important | 76% |
Glassdoor’s survey of employees and job seekers found that more than three-quarters of respondents evaluate companies based on the diversity of their workforce.
Impact of Diversity on Employer Choice
The same research indicates that diversity influences multiple stages of the hiring funnel:
- Candidates are more likely to apply to companies with visible diversity
- Employer reputation is increasingly tied to inclusion practices
- Underrepresented groups place higher importance on diversity when choosing employers
Source: Glassdoor, Diversity & Inclusion Workplace Survey
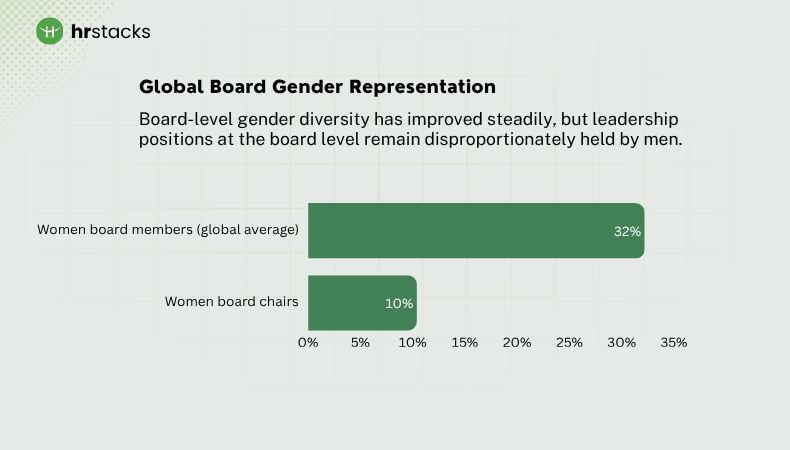
Women Hold 32.2% of Board Seats Globally, but Only 10% of Board Chairs
Board-level gender diversity has improved steadily, but leadership positions at the board level remain disproportionately held by men.
Global Board Gender Representation
| Metric | Value |
|---|---|
| Women board members (global average) | 32.2% |
| Women board chairs | 10.4% |
Deloitte’s analysis covers thousands of companies across multiple regions and tracks board composition trends over time.
What These Numbers Represent
- The 32.2% figure reflects total board seats held by women globally
- The 10.4% figure reflects chair positions, which represent the highest level of board leadership
This gap highlights that while representation is improving, decision-making authority at the board level remains unevenly distributed.
Women Hold 30% of S&P 500 Board Seats, While Racial and Ethnic Diversity Reaches 23%
Board diversity in the United States has increased significantly, particularly among large publicly listed companies.
S&P 500 Board Diversity Snapshot (2024)
| Metric | Value |
|---|---|
| Women directors | 30% |
| Racial/ethnic minority directors | 23% |
This report analyzes board composition across S&P 500 companies, including gender and racial representation.
Source: Spencer Stuart, U.S. Board Index
Black and Hispanic Workers Each Represent Less Than 10% of the U.S. Tech Workforce
Racial and ethnic representation in technology roles also shows clear disparities when compared to overall labor force participation.
Representation in U.S. Computer and Mathematical Occupations
| Group | Representation |
|---|---|
| White | 62.4% |
| Asian | 20.5% |
| Black | 8.3% |
| Hispanic | 8.0% |
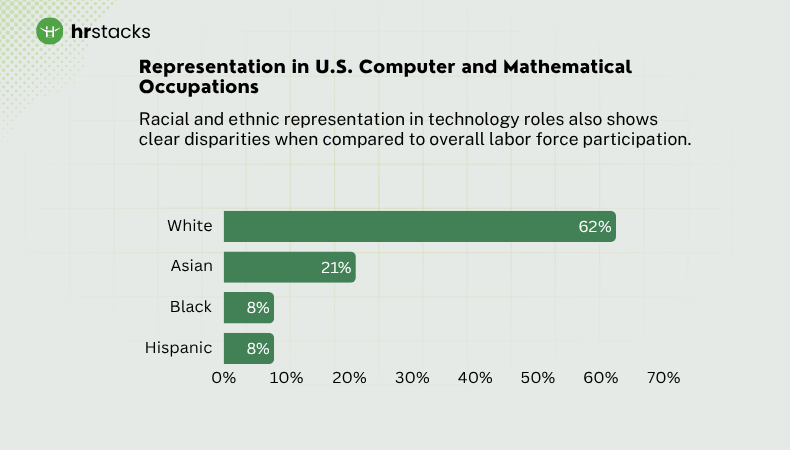
Source: U.S. Bureau of Labor Statistics
Comparison to Overall U.S. Workforce
| Group | Workforce Share | Tech Roles Share |
|---|---|---|
| Black workers | 12–13% | 8.3% |
| Hispanic workers | 18–19% | 8.0% |
Source: BLS labor force data
What This Data Shows
- Early talent pipelines (STEM education and hiring pathways)
- Women are significantly underrepresented in computing roles compared to their share of the overall workforce
- Black and Hispanic workers are also underrepresented relative to the national labor force composition
Representation gaps are most visible in:
- technical roles (engineering, development)
- senior technical leadership
Women Hold 26.7% of U.S. Computing Jobs, Indicating a Persistent Gender Gap in Technical Roles
Gender representation in technology remains uneven, particularly in core computing occupations such as software development, data science, and systems analysis.
Women’s Representation in U.S. Computer and Mathematical Occupations
| Metric | Value |
|---|---|
| Women in computer & mathematical occupations | 26.7% |
| Men in computer & mathematical occupations | 73.3% |
Source: U.S. Bureau of Labor Statistics
The BLS “computer and mathematical occupations” category covers:
- Software developers
- Computer systems analysts
- Database administrators
- Data scientists and related roles
Comparison With Overall Workforce Participation
| Metric | Value |
|---|---|
| Women in total U.S. workforce | 46.8% |
| Women in computing roles | 26.7% |
Source: BLS CPS Table A-11 (same dataset)
This reflects a 20 percentage point gap, showing that women are significantly underrepresented in technical roles relative to their overall workforce participation.
Employees Experiencing Bias Are 1.4x More Likely to Leave, Highlighting Inclusion-Driven Attrition Risk
Retention disparities are one of the most measurable outcomes of weak inclusion practices. Large-scale workforce studies show that employee experience—particularly bias, belonging, and manager support—directly influences turnover rates among underrepresented groups.
McKinsey’s analysis shows that employees who report experiences such as microaggressions, exclusion, or unequal treatment are significantly more likely to consider leaving their organization.
Inclusion and Belonging as Drivers of Retention
Research consistently identifies belonging as a key factor influencing whether employees stay or leave.
Employees who feel excluded or unsupported are more likely to:
- Disengage from work
- Reduce participation in team activities
- Actively seek new job opportunities
Source: McKinsey & Company
While exact percentages vary by study, the directional finding is consistent across datasets: lack of inclusion increases voluntary attrition risk.
Manager Behavior and Engagement as Retention Drivers
Manager quality and workplace experience are among the strongest predictors of retention outcomes.
| Factor | Impact on Retention |
|---|---|
| Manager support and engagement | Strongest predictor of retention |
| Inclusive team culture | Higher employee retention |
| Access to career growth opportunities | Reduces turnover risk |
Gallup’s research shows that employees who are engaged and supported by managers are significantly less likely to leave their organizations.
Source: Gallup
Companies With 250+ Employees in the UK Are Required to Report Gender Pay Gap Data Annually
One of the most concrete and verifiable datasets comes from statutory reporting requirements.
UK Gender Pay Gap Reporting (Mandatory Disclosure)
| Metric | Value |
|---|---|
| Companies required to report (250+ employees) | 100% (legal requirement) |
| Employers reporting annually | 10,000+ |
This dataset includes thousands of employers and provides one of the most comprehensive real-world pay gap datasets globally.
Source: UK Government Equalities Office
EU Pay Transparency Directive Requires Pay Gap Reporting and Justification
The European Union has introduced one of the most significant regulatory frameworks around pay equity.
Key Requirements (EU Pay Transparency Directive)
- Companies must disclose gender pay gaps publicly
- Employers must justify pay differences greater than 5%
- Mandatory corrective action required if gaps cannot be justified
U.S. Pay Transparency Laws Now Cover Multiple States and Millions of Workers
In the United States, pay transparency is expanding through state-level legislation.
States With Pay Transparency Laws
- California
- New York
- Colorado
- Washington
These laws require employers to:
- Disclose salary ranges in job postings
- Provide pay information to candidates and employees
DEI Hiring and Corporate Commitments Increased After 2020, but Workforce Impact and Investment Have Since Slowed
Following 2020, many organizations made public commitments to expand diversity, equity, and inclusion (DEI) efforts. However, workforce data and corporate reporting show that while hiring and attention increased initially, long-term structural impact and investment growth have been more limited.
Corporate Hiring and Workforce Changes After 2020
A large-scale analysis of employment data across major U.S. companies shows that diversity gains were real but modest relative to expectations.
| Metric | Change (2020–2023) |
|---|---|
| Non-white representation in senior management | 22% → 26% |
| Black representation in leadership | 5% |
| Hispanic representation in leadership | 5% |
This dataset highlights that:
- Most diversity gains occurred in entry-level and mid-level roles
- Leadership representation improved only slightly
Evidence of Slowing or Reversal in DEI Programs
Recent corporate reporting and news coverage show that some companies have begun scaling back or restructuring DEI initiatives.
- Several large companies have reduced or eliminated dedicated DEI teams
- Others have shifted away from explicit diversity targets in public disclosures
- Legal and political pressures have influenced how DEI programs are structured and communicated
Source: Wall Street Journal
44% of Organizations Use AI in Hiring, While Bias Risks Remain Documented in Research
The use of AI in recruitment has expanded across resume screening, candidate matching, and interview automation. However, adoption is still uneven, and multiple studies show that algorithmic systems can introduce or amplify bias if not properly audited.
Adoption of AI in Recruitment and Hiring
| Metric | Value |
|---|---|
| Organizations using AI in recruitment and hiring | 44% |
| Recruiters reporting AI speeds up screening and matching | 75% |
| Reduction in time-to-hire with AI tools | up to 50% |
Source: Industry workforce research and HR analytics datasets
These figures show that AI is most commonly used in:
- Early-stage candidate screening
- Resume parsing and shortlisting
- Interview scheduling and automation
Efficiency Gains from AI in Hiring Workflows
Organizations adopting AI report measurable operational improvements.
- Nearly 89% of HR professionals using AI in recruiting say it saves time or increases efficiency
- Companies using AI report reduced hiring costs and faster decision cycles
Source: SHRM
This explains why AI adoption is concentrated in high-volume hiring environments.
Documented Bias Risks in AI Hiring Systems
Academic and industry research consistently identifies risks tied to how AI models are trained and deployed.
| Risk Area | Impact on Hiring Outcomes |
|---|---|
| Historical training data bias | Replicates past discrimination patterns |
| Proxy variables (e.g., education, location) | Indirect bias against protected groups |
| Lack of audit mechanisms | Bias remains undetected at scale |
| Over-reliance on automation | Reduces human judgment and oversight |
One-Third of LGBTQ+ Employees Would Leave Jobs for More Inclusive Workplaces
Workplace inclusion has a direct impact on retention among LGBTQ+ employees. Survey data consistently shows that lack of inclusion is a key driver of job-switching behavior, often outweighing compensation or role-related factors.
LGBTQ+ Workforce Representation in the United States
| Metric | Value |
|---|---|
| U.S. adults identifying as LGBTQ+ | 7.1% |
| Gen Z adults identifying as LGBTQ+ | 19.7% |
The data shows a significant generational shift, with younger workers identifying as LGBTQ+ at nearly three times the rate of the overall population.
Source: Gallup
LGBTQ+ Employee Retention and Workplace Preferences
| Metric | Percentage |
|---|---|
| LGBTQ+ employees willing to leave for a more inclusive workplace | 33% |
This finding indicates that inclusion is not just a cultural factor, but a material driver of retention and workforce stability.
Western Europe Closes 76.3% of Gender Gap While South Asia Lags at 62.8%
Gender equality outcomes vary significantly across regions, and one of the most widely used benchmarks is the Global Gender Gap Index published annually by World Economic Forum.
This index measures gender parity across four dimensions:
- Economic participation
- Educational attainment
- Health and survival
- Political empowerment
A score of 100% represents full gender parity.
Gender Gap Closure by Region
| Region | Gender Gap Closed |
|---|---|
| Western Europe | 76.3% |
| North America | 75.0% |
| Latin America & Caribbean | 74.3% |
| East Asia & Pacific | 68.8% |
| Sub-Saharan Africa | 68.2% |
| South Asia | 62.8% |
| Middle East & North Africa | 61.7% |
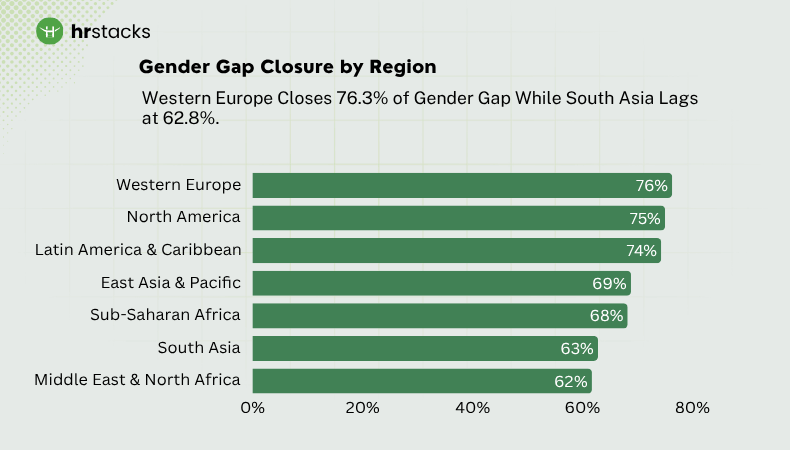
Source: World Economic Forum
Key Regional Differences
Western Europe and North America lead due to:
- Stronger labor policies
- Higher female workforce participation
- Better access to education
South Asia and MENA regions lag due to:
- Lower workforce participation rates for women
- Cultural and structural barriers
- Limited leadership representation
Conclusion
While organizations have improved diversity at entry levels, structural gaps remain in promotion, leadership, and pay. Women hold 63% of entry-level roles but only 29% of C-suite positions, and early promotion disparities continue to limit long-term progress.
At the same time, the business case is clear. Companies with diverse leadership teams generate higher innovation revenue, and those in the top diversity quartile are more likely to outperform financially. On the workforce side, inclusion directly impacts retention, with employees experiencing bias 1.4× more likely to leave.
The shift now is from measurement to accountability. Organizations that focus on career progression, pay equity, and inclusive workplace experience, not just hiring, will see the most meaningful results.
Ultimately, DEI is not just a workplace initiative, it is a driver of performance, retention, and long-term growth.