employee-benefits

2025 Employee Benefits Statistics That Influence Retention

Employee benefit trends show employers rethinking coverage as costs rise and employee expectations evolve. FSAs are declining, HSAs and GLP-1 coverage are expanding, and wellbeing remains central to retention.

Editor's Choice: Employee Benefit Statistics

Top Employee Benefit Statistics in 2025
health coverage
97%
Employers offer some form of health coverage
employer health
5.8%
Projected rise in employer health benefit costs for 2025-26
mental health
3 in 10
Employees say senior leaders don’t prioritize mental health
mental health
1.3×
Employees who feel cared for are more likely to stay
job-search
51%
U.S. workers are actively or passively job-seeking
employee recognition
45%
Well-recognized employees are less likely to leave within two years

Check All Employee Benefit Statistics

Here are some of the most important Employee Benefit Statistics that you need to know about.

Health Coverage & Cost Trends

1

Nearly All Employers Offer Health Plans (97%).

Nearly 97% of employers report offering some form of health coverage, which makes medical benefits a table-stakes offering. That ubiquity hides variation: plan generosity, network access, mental-health coverage, and ease of use differ widely, and those differences, more than mere availability, shape retention.

Employee Health Benefit
2

Employers Forecast 5.8% Increase In Health Benefit Costs For 2025.

Employers project roughly a 5.8% rise in health benefit costs for 2025 (Mercer/Reuters). That uptick tightens budgets and forces trade-offs, higher premiums, narrower networks, or stricter utilization management, and makes it harder for HR to expand perks without clear retention ROI.

Health Benefit Cost Increase
3

Large Employers Increasingly Cover Glp-1/Weight-Loss Drugs; Adoption Rose In 2024.

Coverage of GLP-1 weight-loss drugs climbed in 2024, especially among the largest employers. As firms add these costly therapies, claims exposure and utilization-management questions rise, prompting prior authorization and access limits, raising hard questions about affordability and benefit design.

4

Many Employers Forecast Tougher Health-Cost Inflation; >50% Plan Cost-Management Moves In 2025.

With Mercer/Reuters flagging near-6% health-cost growth for 2025, a majority of employers are planning cost-management steps. Expect tighter networks, authorizations, and plan redesigns, changes HR must balance carefully to avoid eroding perceived benefit value and risking turnover.

5

Employer HSA Contributions Rose Modestly In 2025 While FSA Prevalence Declined To 60%.

More employers are steering workers toward Health Savings Accounts, with contributions rising modestly in 2025. Meanwhile, FSAs are becoming less common, now offered by about 60% of employers. The shift reflects a preference for benefits that give employees more flexibility and control over their healthcare spending.

6

Employer Benefit Mix Shifting: FSAs Down, HSA Support and GLP-1 Coverage Rising

SHRM’s 2025 Employee Benefits Survey shows clear movement in employer-sponsored health benefits. Flexible Spending Accounts (FSAs) continue to decline, offered by about 60% of employers, down from 63% in 2024 and nearly 68% in 2021. Dependent-care FSAs also fell to 54%, an 11-point drop since 2021.

Employee Wellbeing & Mental Health

7

Rising Stress And Burnout: 3 In 10 Employees Say Senior Leaders Don’t Prioritize Mental Health.

Multiple surveys report rising stress and burnout; Deloitte finds roughly three in ten employees believe senior leaders don’t prioritize mental health. That perception undermines psychological safety and reduces help-seeking, making benefits less effective unless leaders consistently and publicly model wellbeing behaviors. Source: Deloitte

Employee Burnout
8

Feeling Cared For Makes Employees 1.3× More Loyal and 1.2× More Productive

MetLife links an employer’s visible “care” to results: employees who feel cared for are about 1.3× more likely to stay and 1.2× more productive. In short, benefits framed as genuine, easy-to-use support deliver measurable retention and performance gains when deployed consistently.

Happy Employee
9

Employees Who Understand Their Benefits Report Much Higher Satisfaction & Stability.

MetLife shows employees who understand and can use benefits report higher well-being and perceived job stability. Benefits literacy, clear enrollment guidance, ongoing reminders, and practical examples often matter more than incremental benefit additions.

Satisfied Employee

Flexibility, Work Preferences & Work-Life Balance

10

60% Of Workers With Remote-Capable Jobs Want Hybrid Arrangements.

Gallup shows about six in ten remote-capable employees prefer hybrid schedules. That’s a middle ground, autonomy without total isolation, and employers who deliver predictable hybrid rhythms (not ad-hoc mandates) are more likely to keep employees calm, engaged, and less likely to look elsewhere.

Six in ten remote-capable employees prefer hybrid work schedules.
11

Fortune 100: About 71% Remain Flexible (3-Day Hybrid Most Common).

Industry trackers report roughly 71% of Fortune-100 firms offer some flexibility, with three-day hybrid patterns common. But policy tightening is visible; “flexible” on paper doesn’t always equal flexible in practice, so measure actual attendance and policy stringency before benchmarking.

Hybrid work stats
12

50.9% Of Employees Would Accept Lower Pay For Better Work/Life Balance; 40.8% For Greater Flexibility.

SHRM finds roughly 51% would trade salary for improved work-life balance and about 41% for greater flexibility. These are real tradeoffs people make, so well-designed schedules and leave options can act as currency when cash budgets are constrained.

Work_Life Balance

Onboarding, Engagement & Recognition

13

Employees With A Strong Onboarding Experience Are 69% More Likely To Remain 3+ Years.

Structured onboarding pays off: employees reporting excellent onboarding are roughly 69% likely to stay three years. Clear role setup, mentorship, and simple benefits walkthroughs convert offerings into belonging and substantially reduce early-stage leakage.

Onboarding Experience
14

Well-Recognized Staff Are 45% Less Likely To Leave Over Two Years.

Gallup shows well-recognized employees are about 45% less likely to change organizations over two years. Recognition, specific, timely, manager-delivered, signals value cheaply and reliably; it’s a high-ROI retention lever that complements formal benefits.

Well-Recognized Staff
15

Organizations With High Engagement See 21–51% Less Turnover.

Gallup-based analyses reported via WebMD show engagement can cut turnover by roughly 21% in high-turnover contexts and up to 51% in low-turnover contexts. Engagement work reduces attrition and amplifies the value of benefits that employees actually use. Source: WebMD Health Services

Employee Turnover

Retention & Turnover Economics

16

Organizations Retain About 83% of New Hires After One Year

Median new-hire retention is about 83% at one year, meaning ~17% of hires depart within twelve months. Early churn often signals onboarding, manager, or benefits friction and is usually more tractable than entrenched attrition. Fixes here yield quick returns. Source: HR Executive

New-hire retention
17

Paid Family Leave Can Cut Turnover by Up to 70%

Research and program evaluations find that generous paid family leave strongly lowers post-leave attrition; some cohorts report reductions up to about 70%. Paid leave acts as retention insurance for caregivers and preserves institutional knowledge when access and return-to-work supports are clear.

Paid family leave as retention policy
18

Replacing an Employee Costs About 33% of Their Annual Salary

Work Institute and similar analyses estimate a typical replacement cost of around 33% of base salary when recruiting, onboarding, and productivity loss are tallied. Use this conservative proxy when modeling benefit ROI; the math often favors targeted retention investments.

Employee Replacement Cost
19

Employee Replacement Costs Range From 0.5× to 2× Salary, Depending on Role

Broader studies (Gallup and industry analyses) put replacement costs between 0.5× and 2× annual salary, with senior or highly technical roles at the high end. Tailor your ROI models to role complexity rather than treating all headcount equally.

Employee replacement cost

Labor Market & Retention Pressure

20

51% Of U.S. Workers Were Watching Or Actively Seeking New Work.

Gallup tracked roughly half of workers watching or actively seeking new opportunities in 2024, a persistent, high-intent labor market. That continuous churn pressure makes visible, well-communicated benefits an asset for retention rather than a nice-to-have.

Seeking New Work

Employee Benefit Statistics Conclusion

The benefits landscape reflects a quiet but meaningful shift in how employers think about support. Health coverage remains nearly universal, yet the structure of those plans, what they include, how they’re funded, and how clearly they’re explained, now matter more than the coverage itself.

Traditional options like FSAs are fading, while HSAs, GLP-1 coverage, and broader wellbeing initiatives are gaining ground.

What stands out across the data is a growing focus on value alignment: benefits that feel relevant, accessible, and genuinely supportive. Employees continue to respond to cultures that show care, where flexibility, recognition, and well-being aren’t side perks but part of how work gets done.

For HR leaders, this year’s challenge isn’t just managing rising costs, but ensuring every benefit offered earns real trust and strengthens connection.

Key Benefit Statistics at a Glance

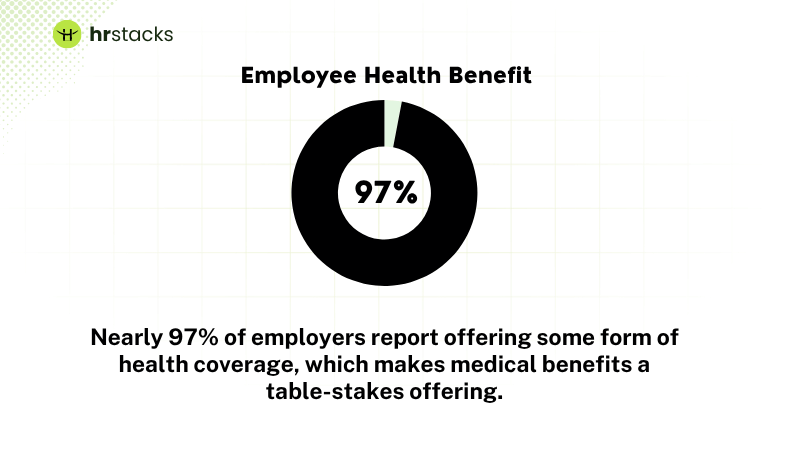
  • 97% of employers offer health coverage.
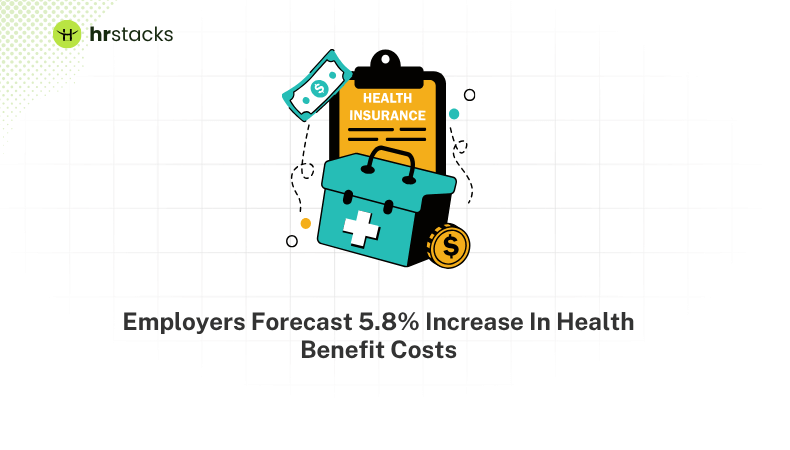
  • 5.8% projected rise in employer health benefit costs for 2025.
  • 60% of employers offer FSAs, down from 68% in 2021.
  • 23% now cover GLP-1 weight-loss or diabetes medications.
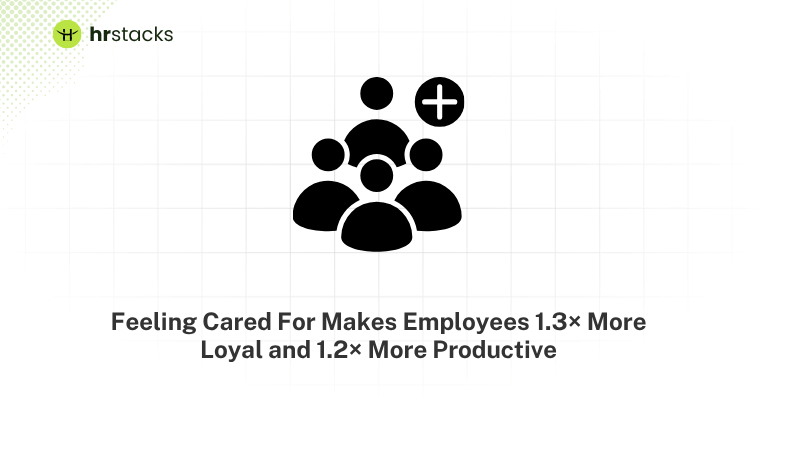
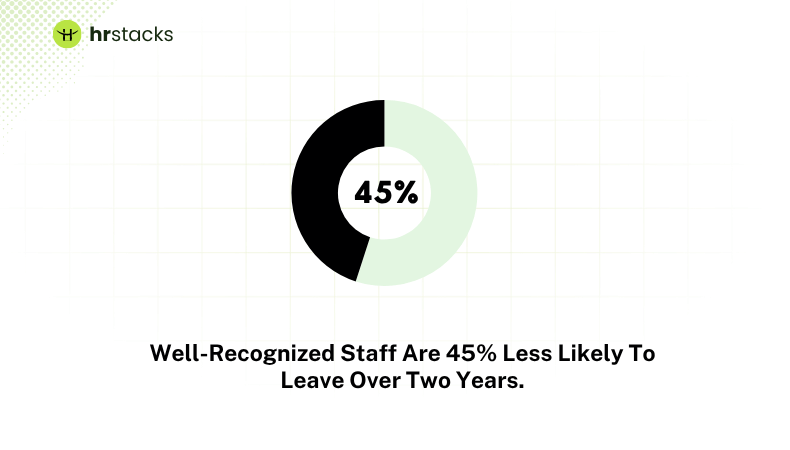
  • Employees who feel cared for are 1.3× more likely to stay and 1.2× more productive.
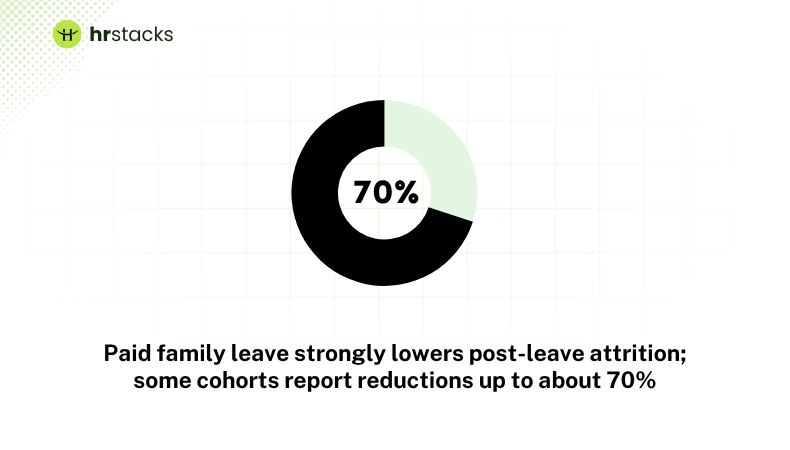
  • Paid family leave can reduce turnover by up to 70%.

Get HR Stacks Weekly
Get our weekly news update with all latest news in HR community.
Featured Products
When I Work Logo
When I Work
When I Work is a scheduling tool...
HiBob Logo
HiBob
HiBob is a modern HRIS designed for...
Deel Logo
Deel
Deel is a well-recognized all-in-one HR solution...
Pebl Logo
Pebl
Pebl (formerly Velocity Global) is a leader...
Rippling Logo
Rippling
Rippling is a renowned workforce management software...
Contributors
Manjuri Dutta
Manjuri Dutta
Manjuri Dutta is the co-founder and Content Editor of HR Stacks, a leading HR tech and workforce management review platform, and EmployerRecords.com, specializing in Employer-of-Record services for global hiring. She brings a thoughtful and expert voice to articles designed to inform HR leaders, practitioners, and tech buyers alike.
Shreyashi
Shreyashi
Shreyashi is a content writer with over 5 years of experience, specializing in the HR and workplace technology space. She focuses on creating insightful, research-driven content that helps HR professionals navigate the evolving world of talent, tech, and people strategy.
Follow The Author:
Latest Statistics
Receive the latest HR news

Subscribe To Our Weekly HR Newsletter

Get the latest from the HR & AI tech industry. All your news at one place. 

HR Stacks uses cookies

This website uses cookies to enhance user experience and to analyze performance and traffic on our website. By continuing to browse this site you are agreeing to our use of cookies.