Employers using skills-based hiring for entry-level roles
70% (2026)
NACE
Organizations using skills-first hiring often or almost always
34% (2025)
SHRM
U.S. job postings requiring a bachelor’s degree or higher
19.3% (Nov 2025)
Indeed Hiring Lab
Employers screening entry-level candidates by GPA
42% (2026)
NACE
Hires affected by corporate degree-removal policies
Fewer than 1 in 700 (2024)
Burning Glass Institute, HBS
Global talent pool expansion under skills-based hiring
6.1x (2025)
LinkedIn Economic Graph
Retention advantage for non-degree hires at leader firms
+10 pts (2024)
Burning Glass Institute, HBS
U.S. states acting to remove degree requirements from state jobs
32 (2021 to 2025)
Opportunity@Work
Key Takeaways
Skills-based hiring is growing fastest in early-career recruiting, where 70% of NACE employers now use it, up from 65% a year earlier.
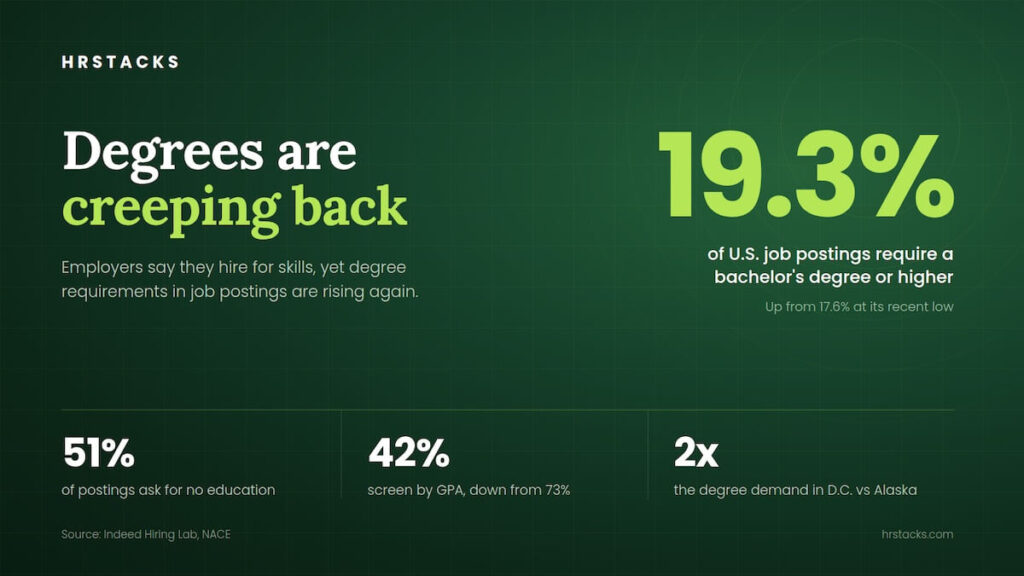
Job postings are moving the other way: the share of Indeed postings requiring a bachelor’s degree climbed back to 19.3% in November 2025 after falling to 17.6% in October 2024.
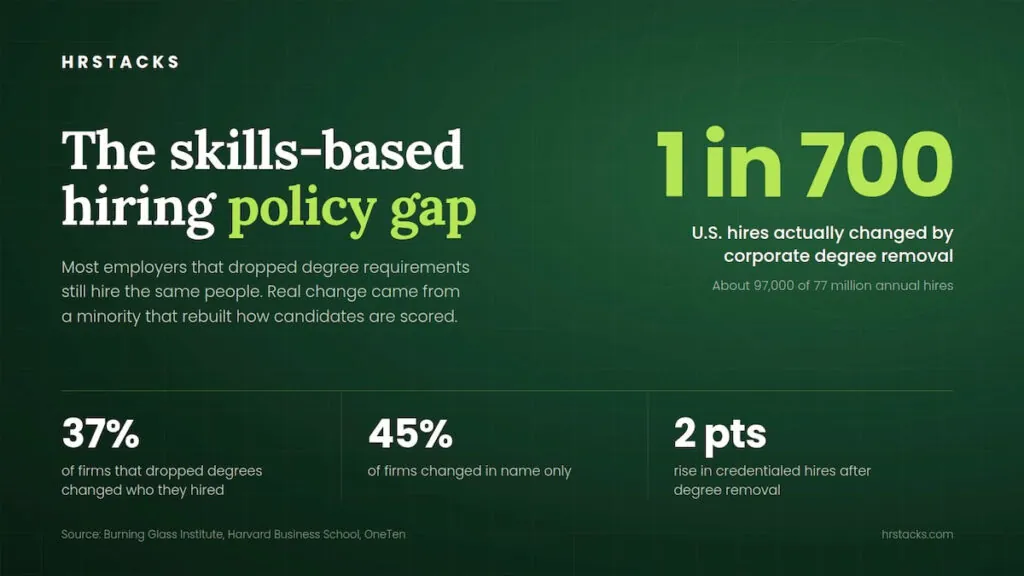
Removing degree language rarely changes who gets hired, with fewer than 1 in 700 hires affected and only 37% of firms that dropped requirements actually changing their hiring.
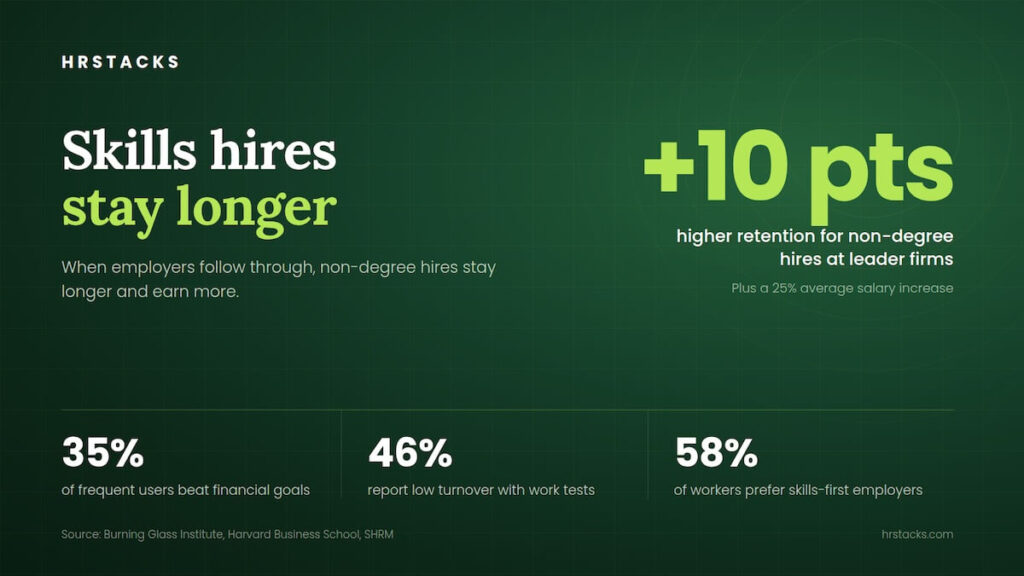
Employers that follow through see results, as non-degree hires at leader firms show 10-point higher retention and a 25% average salary gain.
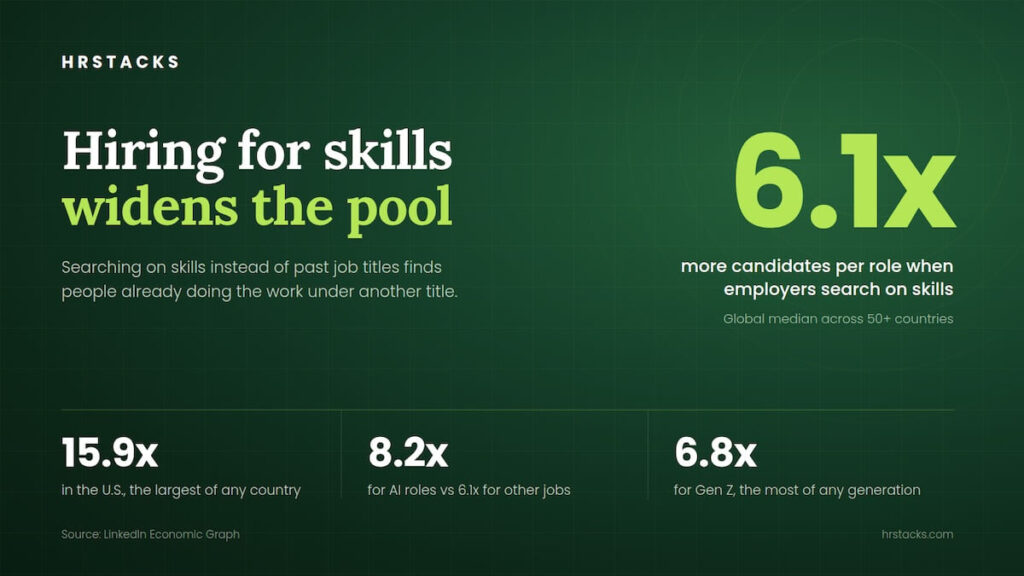
Matching on skills instead of job titles expands candidate pools 6.1x globally and 15.9x in the U.S., the largest increase among the countries LinkedIn analyzed.
Skills-based hiring adoption rates: how many employers hire for skills
Adoption figures for skills-based hiring vary widely, and the difference usually comes down to what a survey counts. A study that counts any use of assessments lands far higher than one asking how often skills actually decide who gets hired.
70% of employers use skills-based hiring for entry-level roles
NACE’s Job Outlook 2026 survey found 70% of employers use skills-based hiring for entry-level candidates, up from 65% a year earlier. Data came from 183 employers surveyed between August and September 2025.
Employers using skills-based hiring for entry-level roles
Job Outlook 2025
65%
Job Outlook 2026
70%
Stat 02
87%
apply it in interviews
Interviews are where employers apply skills-based hiring most
Among NACE employers using skills-based hiring, 87% apply it during interviews and 65% during screening. 71% use it for at least half of their entry-level hires, so for most it is standard practice rather than a pilot.
Skills-based hiring adoption ranges from 34% to 70%
SHRM finds 34% of organizations use skills-first strategies often or almost always, while NACE puts entry-level use at 70%. The gap reflects what each survey measures, not a contradiction in the data.
Organizations using skills-first hiring often or almost always.
NACE, entry-level
70%
Employers using skills-based hiring in any form for new graduates.
SHRM measures how consistently skills drive all hiring decisions, while NACE counts any use in early-career recruiting, where assessments were already common.
Stat 04
1 in 3
use it consistently
Only 1 in 3 organizations use skills-first hiring consistently
In SHRM’s October 2025 survey of 1,184 HR professionals, 34% said skills-first strategies are used often or almost always, while 25% said never or rarely. More than half of that low-use group said they want to adopt the approach.
19% of employers plan to drop degree requirements, 30% in India
In the World Economic Forum’s Future of Jobs Report 2025, 19% of employers globally named removing degree requirements as a strategy to improve talent availability. Employers in India were far more likely to plan the change, at 30%.
Share of 1,000+ surveyed employers representing 14M+ workers.
India
30%
Indian employers also lead on diversifying talent pools, at 67% vs 47% globally.
Stat 06
70%
of HR professionals
70% of HR professionals expect skills-first hiring to grow
SHRM’s 2025 survey found 70% of HR professionals expect skills-first practices to play a larger role in hiring decisions over the next 3 years. AI is a major driver, with 80% expecting employers to prioritize candidates who can show AI-related competencies.
College degree requirements in job postings: what the 2025 and 2026 data shows
Job postings are the clearest test of whether degree requirements are actually going away, and the latest data complicates the popular story. Indeed Hiring Lab shows the share of postings asking for a bachelor’s degree bottomed out in 2024 and has been creeping back up since.
The same tightening shows up in location requirements, tracked in our hybrid work statistics. Meanwhile, early-career employers are dropping GPA filters and state governments are rewriting job specs for their own recruitment pipelines.
Stat 07
19.3%
of U.S. postings (Nov 2025)
Bachelor’s degree requirements are rising again in U.S. job postings
19.3% of Indeed job postings required a bachelor’s degree or higher in November 2025, up from 17.6% in October 2024. Indeed finds the share has risen since early 2024 even after adjusting for shifts in occupational mix.
51% of U.S. job postings list no formal education requirement
A small majority of Indeed postings in November 2025 did not ask for any formal education. Bachelor’s requirements remain embedded in roughly 1 in 5 postings, concentrated in knowledge work, healthcare, and engineering roles.
Education requirements in U.S. job postings, Nov 2025
No formal requirement: 51%
Other education (remainder): 29.7%
Bachelor’s or higher: 19.3%
Stat 09
22.4%
D.C. postings, adjusted
Degree requirements run twice as high in D.C. as Alaska
After adjusting for occupational mix, 22.4% of Washington, D.C. job postings required a bachelor’s degree in November 2025, compared with 10.6% in Alaska. Unadjusted, D.C. led at 43.7%, followed by Washington state at 31.5%.
Postings requiring a bachelor’s degree, occupation-adjusted
Alaska
10.6%
The lowest adjusted share of any state in Indeed’s November 2025 data.
Washington, D.C.
22.4%
The highest adjusted share, driven by federal and professional services hiring.
Stat 10
42%
screen by GPA (2026)
GPA screening dropped from 73% to 42% of employers since 2019
In 2019, 73% of employers in NACE’s survey screened entry-level candidates by GPA. By the Job Outlook 2026 survey that share fell to 42%, with skills-based screening partly taking its place.
State job postings requiring degrees fell nearly 10 points after reforms
In states that acted to remove degree requirements by April 2023, 51.1% of above-median-wage roles required a bachelor’s degree in the 12 months before the change. In the 12 months after, that share fell to 41.8%.
State government postings requiring a bachelor’s degree
12 months before
51.1%
12 months after
41.8%
Degree removal vs. actual hiring: the skills-based hiring policy gap
Dropping a degree line from a job posting takes minutes. Changing who actually gets hired takes rewritten scoring rubrics, retrained interviewers, and HRIS and ATS setups that can capture skills and credentials, not just education fields. Research from the Burning Glass Institute, Harvard Business School, OneTen, and SHRM tracks what happened after employers made the announcement, and where most of them stalled.
Stat 12
1 in 700
U.S. hires affected
Degree removal changed fewer than 1 in 700 U.S. hires
Burning Glass Institute and Harvard Business School tracked 11,300 roles at large firms that dropped degree requirements. Non-degree hiring in those roles rose 3.5 points, but only 3.6% of roles made the change, netting about 97,000 of 77 million annual hires in 2023.
Only 37% of firms that dropped degrees changed who they hired
Burning Glass and HBS grouped firms by what happened after they removed degree requirements. Leaders raised their share of non-degree hires by nearly 20%, while 45% changed in name only and 18% made short-term gains that later reversed.
Firms that removed degree requirements, by outcome
Skills-based hiring leaders: 37%
In name only: 45%
Backsliders: 18%
Stat 14
2 pts
rise in credentialed hires
Dropping degree requirements lifted credential-holder hires by just 2 points
OneTen and the Burning Glass Institute found most firms remove degree requirements without adding any credential requirement in their place. Across 1,000+ large U.S. employers, those that dropped degrees saw only a 2-percentage-point rise in hires holding non-degree credentials.
Top firms hire credential holders 11 points more often than laggards
After controlling for occupation and industry, firms in the top 10% hire for non-degree credentials 11 percentage points more often than the bottom 10%. The study found no correlation between how often firms request credentials in postings and how often they hire credentialed workers.
86% of HR teams hit barriers implementing skills-first hiring
Among organizations using skills-first hiring to any degree, 86% of HR professionals and 91% of supervisors reported hurdles that slowed progress. Reliance on degree-based methods and a lack of skills assessment tools tie as the top barriers, each cited by 29% of HR professionals.
Top barriers to skills-first hiring, HR professionals
Reliance on degree requirements
29%
No skills assessment tools
29%
Inconsistent practices across teams
25%
Limited awareness of the approach
24%
Pressure to hire quickly
23%
Skills-based hiring talent pool statistics: how much candidate pools expand
Talent pool expansion is the strongest argument for skills-based hiring, and LinkedIn’s Economic Graph has the largest dataset on it. Its March 2025 report compares candidate pools built on past job titles with pools built on shared skills, using data through January 2025 across more than 50 countries.
The gains vary sharply by market, which matters if you hire across borders directly or through an employer of record. Some of this hidden talent also sits in contract work, covered in our gig economy and freelance statistics.
Stat 17
6.1x
global median increase
Skills-based hiring expands talent pools 6.1x globally, 15.9x in the U.S.
LinkedIn compared candidate pools built on past job titles with pools built on shared skills across 56 countries. Every country saw its pool grow, from 15.9x in the U.S. and 12.9x in Brazil down to 1.1x in Slovenia.
Talent pool increase under skills-based hiring, by country
United States
15.9x
Brazil
12.9x
United Kingdom
8.4x
Global median
6.1x
Slovenia
1.1x
Stat 18
8.2x
AI roles, global
AI talent pools grow 8.2x under skills-based hiring
Skills-based matching expands the global pipeline for AI engineering roles 8.2x, 34% more than the 6.1x increase for other jobs. India shows the largest AI expansion among major markets at 22.1x.
Median increase for all other occupations worldwide.
AI roles
8.2x
In the U.S., AI pools grow 16.7x vs 15.9x for other roles.
Stat 19
3.5x
green jobs, global
Green job talent pools grow 3.5x, led by Saudi Arabia at 10.3x
Green roles show the smallest global expansion because they depend on specialized skills with fewer transfer paths. Even so, workers without degrees see an 18% larger pool increase for green jobs than degree holders.
Industry talent pools grow up to 21.5x under skills-based hiring
Industries where skills overlap across many job titles gain the most, led by farming, ranching, and forestry at 21.5x globally. At the country level the effect can be extreme, including 86.4x for real estate and equipment rental in India.
Gen Z gains the most from skills-based hiring at 6.8x
Younger workers have held fewer target job titles but often built matching skills in adjacent roles. The pattern is sharpest in the U.S., where Gen Z pools grow 17.6x overall and 25.7x for AI jobs.
Workers without degrees see 6% larger talent pool gains
Globally, skills-based hiring expands the pool of non-degree workers 6.3x versus 5.9x for bachelor’s degree holders. The gap is widest in the Philippines at 19%, Chile at 18%, and Denmark at 17%.
Median pool increase for workers holding a four-year degree.
No bachelor’s degree
6.3x
The gap rises to 36% in education and 33% in utilities.
Skills-based hiring for women, STARs, and workers without degrees
Talent pool math only matters if it reaches the people that degree filters and job-title searches screen out. This section covers women in male-dominated fields, workers without four-year degrees, and the 70 million-plus U.S. workers that Opportunity@Work calls STARs, meaning workers skilled through alternative routes. For the broader representation picture, see our DEI in the workplace statistics.
Stat 23
+24%
women in U.S. AI pools
Skills-based hiring could raise women’s share of U.S. AI talent pools 24%
Searching on skills rather than job titles would lift women’s share of U.S. AI talent pools from 25% to 31%, a 24% relative increase. Globally the share rises from 26% to 28%, so the widely quoted 24% figure is a U.S. result, not a global one.
Relative increase in women’s share of AI talent pools
Global
+8%
Women’s share of AI pools rises from 26% to 28%.
United States
+24%
Women’s share rises from 25% to 31%, the largest gain among major markets.
Stat 24
+13%
female share, global
Women’s share rises 13% in male-dominated jobs under skills-based hiring
In occupations where women are most underrepresented, such as software engineering and construction management, skills-based pools raise female representation 13% globally. In the U.S., only 9% of DevOps architects are women, but women make up 18% of the skills-based pool for the role.
Increase in women’s representation, most male-dominated roles
+16%
United States
+13%
Germany
+12%
United Kingdom
Stat 25
1.8x
application lift vs men
Showing skills matches lifts women’s applications 1.8x more than men’s
When LinkedIn showed job seekers how their skills matched a posting, the increase in applications from women was 1.8 times that of men, with a similar positive effect on hiring. Listing required skills clearly in job descriptions is one of the few skills-first changes with measured candidate behavior behind it.
Credentials raise first-year pay most for Black and Hispanic workers
One year after earning a non-degree credential, Black workers earned $2,116 more a year than matched peers without one, compared with $1,105 for White workers. The gender gap follows the same pattern: women gained $1,600 versus $916 for men.
Annual wage gain one year after earning a credential
Black workers
$2,116
Hispanic workers
$1,694
Asian workers
$1,431
White workers
$1,105
Stat 27
70M+
U.S. STARs
70 million U.S. workers are skilled through alternative routes
Opportunity@Work estimates more than 70 million U.S. workers built their skills through community college, military service, apprenticeships, or on-the-job experience rather than a bachelor’s degree. 31.9 million of them already have the skills for higher-wage roles but work in low- and middle-wage jobs.
STARs have regained more than 10% of 7.5 million lost jobs
Over two decades, degree filters closed about 7.5 million middle- and high-wage jobs to STARs. Opportunity@Work’s April 2025 report finds more than 10% of that access has returned, with 500,000+ postings open to STARs across its partner network in 2024.
Skills-based hiring outcomes: retention, pay, and business results
Most outcome claims for skills-based hiring come from vendor case studies, so this section sticks to two independent datasets: the Burning Glass Institute’s analysis of actual hiring records and SHRM’s 2025 survey of more than 1,100 HR professionals.
Read the SHRM figures as associations, not proof of cause, since firms that commit to skills-first hiring may differ in other ways too. If you’re building a business case, pair these numbers with your own employee retention metrics and what our employee recognition statistics show about keeping new hires engaged.
Stat 29
+10 pts
retention, non-degree hires
Non-degree hires at leader firms show 10-point higher retention
At firms that followed through on skills-based hiring, workers without degrees hired into roles that previously required one had retention rates 10 percentage points higher than their degree-holding colleagues. Those workers also saw a 25% average salary increase.
Consistent skills-first users are more likely to beat financial goals
Organizations that often or always use skills-first hiring were more likely to exceed financial objectives than those using it rarely or sometimes, 35% vs 27%. They also reported a positive company culture more often, 86% vs 78%.
63% of firms that can assess skills meet financial targets
Organizations that know how to assess candidates’ proficiency in role-relevant skills were more likely to meet or exceed financial objectives, 63% vs 51%. And 85% of HR professionals said a reliable skills assessment would make them more likely to accept a candidate without a degree.
Project-based assessments are linked to lower turnover, 46% vs 34%
Organizations using project-based assessments in hiring were more likely to report low or very low turnover. Yet 53% of HR professionals have not adopted or considered the method, and 59% haven’t tried mock sessions, which link to beating financial goals 37% vs 28%.
Organizations that skip work samples in their hiring process.
Use project-based assessments
46%
Organizations that have candidates complete a preassigned project or challenge.
Stat 33
62%
HR rate skills-first effective
Skills-first hiring rated nearly as effective as degree requirements
67% of HR professionals say educational requirements have helped them find successful hires, and 62% say the same of skills-first hiring. Supervisors rate both highly, at 86% and 84%, so skills-first performs on par with degrees rather than clearly ahead of them.
Share rating each method effective for finding successful hires
Supervisors, degree requirements86% say effective
Supervisors, skills-first hiring84% say effective
HR, degree requirements67% say effective
HR, skills-first hiring62% say effective
Rated effective
Not rated effective
Stat 34
58%
of U.S. workers
58% of workers prefer employers that hire for skills
Nearly 3 in 5 U.S. workers in SHRM’s survey would rather apply to an organization that emphasizes skills-first hiring. Upskilling carries even more weight, and workers at employers that don’t promote it are more likely to be job hunting, 35% vs 25%.
Skills assessment and credential statistics: how employers verify skills
Once a degree filter comes off, something has to replace it, and most employers are still working out what. The two main options are direct skills testing, such as structured interviews, work samples, and live tasks run through video interview software, and non-degree credentials.
The credential market has grown so fast that Credential Engine now counts more offerings than any hiring team could reasonably evaluate. The data below shows which methods employers actually use and where verification breaks down.
Stat 35
86%
use behavioral interviews
Behavioral interviews are the most common skills-first hiring method
86% of organizations use behavioral interviewing to assess skills, and 76% define clear skills and competencies for each role. Methods that test skills directly, such as work samples and mock sessions, are used far less often.
U.S. credentials reached 1.85 million in 2025, 5.5x the 2018 count
Credential Engine counted 1,850,034 unique credentials from 134,491 providers in 2025, up from 1,076,358 in 2022. Digital badges now make up more than 1 million of the total, partly because badge platforms reported more completely than in earlier counts.
1 in 4 HR professionals find credential quality too hard to judge
24% of HR professionals and 33% of supervisors say it is too difficult to determine the quality of skills behind a credential. Verification drives the hiring decision, with 65% of HR professionals and 90% of supervisors saying it has a moderate to very high impact.
70% of U.S. workers now hold a skilled credential, up from 45%
The share of workers holding at least one skilled credential rose from 45% in 2021 to 70% in 2025. Employers rarely fund them, though: only 36% of credential holders said their employer helped pay, fully or partly.
Only about 1 in 8 credentials meaningfully boosts wages or careers
Burning Glass Institute’s Credential Value Index, which tracks outcomes for 23,000+ commonly earned credentials against matched peers, finds only about 1 in 8 produces a meaningful wage or career gain. For employers, the practical step is a curated list of high-value credentials per role, not blanket acceptance.
87% of HR professionals now see applicants with skilled credentials
87% of HR professionals encounter applicants with skilled credentials at least sometimes, up from 77% in 2021. Employer use is catching up more slowly, with 78% now using credentials in hiring versus 72% four years earlier.
HR professionals whose organizations use credentials at least sometimes, up from 72%.
Seen in applicants
87%
HR professionals who see credentialed applicants at least sometimes, up from 77%.
Skills-based hiring in government: state and federal statistics
Governments have moved further on skills-based hiring than most private employers, partly because they write their own rules and have to publish them. State action has come mostly through governors’ executive orders tracked by the National Governors Association.
Federal agencies are now under a statutory mandate managed by OPM. For private employers, the public sector is a useful test case because its rules, deadlines, and results are published in the open, down to the assessment and applicant tracking systems agencies use.
Stat 41
32
states since 2021
32 states have moved to drop degree requirements from state jobs
Since 2021, 32 states have taken action to remove unnecessary degree requirements from government jobs, including 9 that joined in 2025 alone. The movement is bipartisan, with executive orders in Indiana and Montana and new legislation in Texas.
Maryland becomes the first state to drop four-year degree requirements for many state jobs.
Jan 2023
Pennsylvania follows with an executive order on the governor’s first full day in office.
Feb 2025
NGA reports 25 states and 1 territory have skills-based hiring directives.
Sep 2025
Texas HB 3923 takes effect, a legislative rather than executive approach.
End 2025
32 states have acted, with 9 joining in 2025
Stat 42
80 days
federal time-to-hire goal
Federal agencies must hire using skills assessments under an 80-day target
The Chance to Compete Act of 2024 requires federal agencies to rank candidates with technical assessments instead of self-rated questionnaires. OPM’s Merit Hiring Plan adds a goal of cutting time-to-hire to under 80 days, with full implementation expected by the end of FY 2028.
Executive Order 13932 directs agencies to review degree requirements.
Dec 2024
Chance to Compete Act signed into law, requiring technical assessments.
May 2025
Merit Hiring Plan sets the under-80-day goal and phases out self-assessments.
Mar 2026
Compliance deadline for the “rule of many” candidate ranking rule.
FY 2028
Full governmentwide implementation target
Stat 43
91.3%
of Indiana state positions
Indiana removed degree requirements from 91.3% of state positions
After an audit ordered in 2025, Indiana cut job classifications requiring a degree to 147, or 16.9% of the total. As of September 2025, 29,305 state positions (91.3%) no longer require a degree.
Indiana state positions without a degree requirement
29,305 positions need no degree
147 classifications still require one
83.1% of classifications degree-free
Stat 44
70%+
of federal workforce
Over 70% of federal employees hold jobs without degree requirements
By the end of 2024, more than 70% of the federal workforce was in positions that did not require a degree, following the 2020 order to review degree requirements. The figure describes position requirements, not the education level of the people holding them.
AI and the future of skills-based hiring: 2026 data on changing skill demands
AI is changing both sides of skills-based hiring: which skills employers screen for, and how fast those skills go stale. Recent data from the World Economic Forum and PwC’s 2026 AI Jobs Barometer shows requirements shifting fastest in the jobs most exposed to AI, including entry-level roles. That puts more weight on hiring for adaptable skills and building them in-house, for example through an internal talent marketplace.
Stat 45
39%
of core skills by 2030
Employers expect 39% of workers’ core skills to change by 2030
The World Economic Forum’s survey of 1,000+ large employers puts expected skill disruption at 39% by 2030, down from 44% in 2023. WEF links the decline to more training, with 50% of workers now completing long-term learning programs versus 41% in 2023.
AI-exposed entry-level jobs are 7x more likely to require senior skills
PwC’s analysis of 2.4 million U.S. entry-level postings found the roles most exposed to AI now ask for traditionally senior skills such as leadership and judgment far more often. These “seniorized” roles grew 35% since 2019, while other entry-level roles shrank 10%.
Change in U.S. entry-level job openings since 2019
Other entry-level roles
-10%
Openings have shrunk as routine junior work declines.
Seniorized AI-exposed roles
+35%
Openings have grown as skill requirements moved up.
Stat 47
62%
AI skills wage premium
AI skills now carry a 62% average wage premium
PwC’s 2026 barometer, covering 1 billion+ job ads in 27 countries and territories, puts the average wage premium for AI skills at 62%, up from 57% a year earlier. Postings requiring AI skills grew 69%, nearly 8 times the 9% growth of the overall jobs market.
Shared skills taxonomies now cover 30 roles and 35 million U.S. jobs
A Burning Glass Institute-led initiative released common skills-first taxonomies for 9 roles in April 2025 and has since expanded to 30 roles, covering 25% of the U.S. private-sector workforce. Shared definitions matter because employers describing the same role differently is a big reason skills signals don’t transfer between companies.
84% of HR professionals say AI raises demand for human skills
84% of HR professionals expect AI to increase the need for power skills such as critical thinking and communication, and 75% expect more demand for technical skills. Only 65% of workers agree on power skills, a gap that could leave training investments misaligned.
The 2026 data shows skills-based hiring winning the argument but not yet the hiring process. Employer surveys report steady adoption and less reliance on GPA and degrees, yet bachelor’s requirements are creeping back into job postings, and most firms that dropped them still hire the same people.
The gap closes where employers build the process behind the policy: defined skills for each role, direct assessments, and a short list of credentials they actually trust. That is also where the retention and pay gains show up, and with AI pushing entry-level roles toward judgment and leadership, the case for hiring on demonstrated skills will only get stronger.
For HR leaders and hiring managers, the practical move is to pick a few high-volume roles, rebuild how candidates are scored, and track who actually gets hired, whether you recruit locally or across borders through an employer of record.
Sources
Source
Publisher
Year
Link
Employer Use of Skills-Based Hiring Practices Grows (Job Outlook 2026)
Alex Vate is the Content Lead and Editor at HRStacks, where he leads editorial strategy and creates trusted content on global hiring, Employer of Record (EOR), HR software, payroll, compliance, and workforce management. With over a decade of experience in content production and editorial leadership, he specializes in turning complex HR and employment topics into practical, easy-to-understand resources for HR professionals, founders, and global employers.
This website uses cookies to enhance user experience and to analyze performance and traffic on our website. By continuing to browse this site you are agreeing to our use of cookies.